Lab Welcome
Solution and paper
Yanai et al 2021 :: R script :: Markdown :: final data xlsx
Lab welcome exercise
This is a simple activity with a few parts to help get you into the mindset of practicing working with data. We will be doing work to allow you to use some specific skills, but the real point of this exercise is to begin to think about beginning to take responsibility for information you construct using data.
1 BMI data
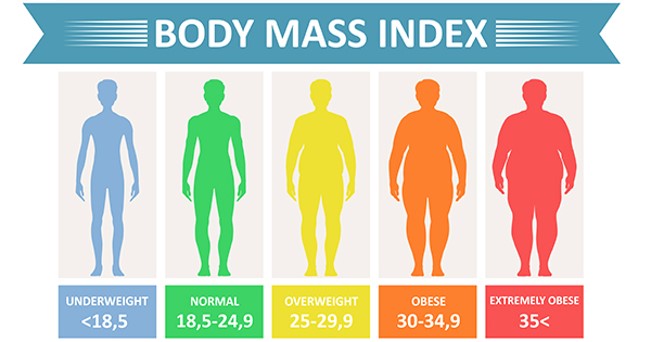
The Body Mass Index (BMI) is a numerical scale intended as a rough guideline to body weight relative to body size. There are a number of assumptions underlying the scale, and the BMI is considered imperfect, but is in wide use.
The BMI is calculated thus:
\(BMI = \frac{weight(Kg)}{height(m^2)}\)
You can calculate your own BMI here
2 Data should be tidy

The concept of tidy data is popular and widely considered best practice. The concept has been summarized in a highly cited paper by Wickham (2014).
The essence of the Tidy Data concept is:
Simple data structure, one observation per row
Simple variable names (informative, short, no spaces, weird characters)
Data explanation or “Data Dictionary” present
No extraneous information (like figures, summaries) embedded with the data storage
3 Exercises
3.1 Make tidy data
Use the following tab-delimited data files: bmi_f.txt bmi_m.txt
The data look like this:
- ID, subject ID within each file
- steps, # steps / wk past 16 weeks
- bmi, bmi measure
- sex is indicated implicitly by males and females data being separated in different files
Your task:
- Convert the data to a tidy data format in a single .xlsx file
- Do this using only R code
- Data dictionary may be added with code or “manually”
- We will scrutinize and discuss
3.2 Analyse BMI data
Consider three specific hypotheses:
that there is a statistically significant difference in the average number of steps taken by men and women
that there is a negative correlation between the number of steps and the BMI for women
that this correlation is positive for men
- Perform analysis ~30 mins
- Do not speak to others
- We will discuss of findings as a group
3.3 Make a data report using markdown
- Markdown is a language
- R markdown is “R flavoured Markdown”
- Format a “dynamic” report using R Markdown
The task here is to create a very brief report of your BMI analysis and findings, using R Markdown. The point here is really just to practice markdown and think of how to communicate results to others.
A markdown document is “freeform” ; the structure I suggest here is a minimal example for good practice.
Title + other details - descriptive title, set in the YAML (“YAML ain’t Markup Language”: recursive acronym…) header Summary of major findings - written LAST
Background - like the introduction section in a scientific paper. The most important part is a list of OBJECTIVES
Results Graphs, stats results, terse, clear, technical style
Bibliography (if relevant) References are usually cited in Background, or possibly in Results if there are methods citations
- Make your own report (~45 mins)
- Start a new R Markdown document in RStudio, HTML output (NB pdf, word options)
- Structured your doc with the sections: Title, Summary, Background, Results, Bibliography
- There are usually several “unseen” sections that may contain your R code in code chunks
- We will discuss and critique resulting reports and code (~45 mins)
Resources
Harper Adams Data Science

This module is a part of the MSc in Data Science for Global Agriculture, Food, and Environment at Harper Adams University, led by Ed Harris.