bmi <- read.xlsx("bmi_male_and_female.xlsx")BMI data swag
Read data
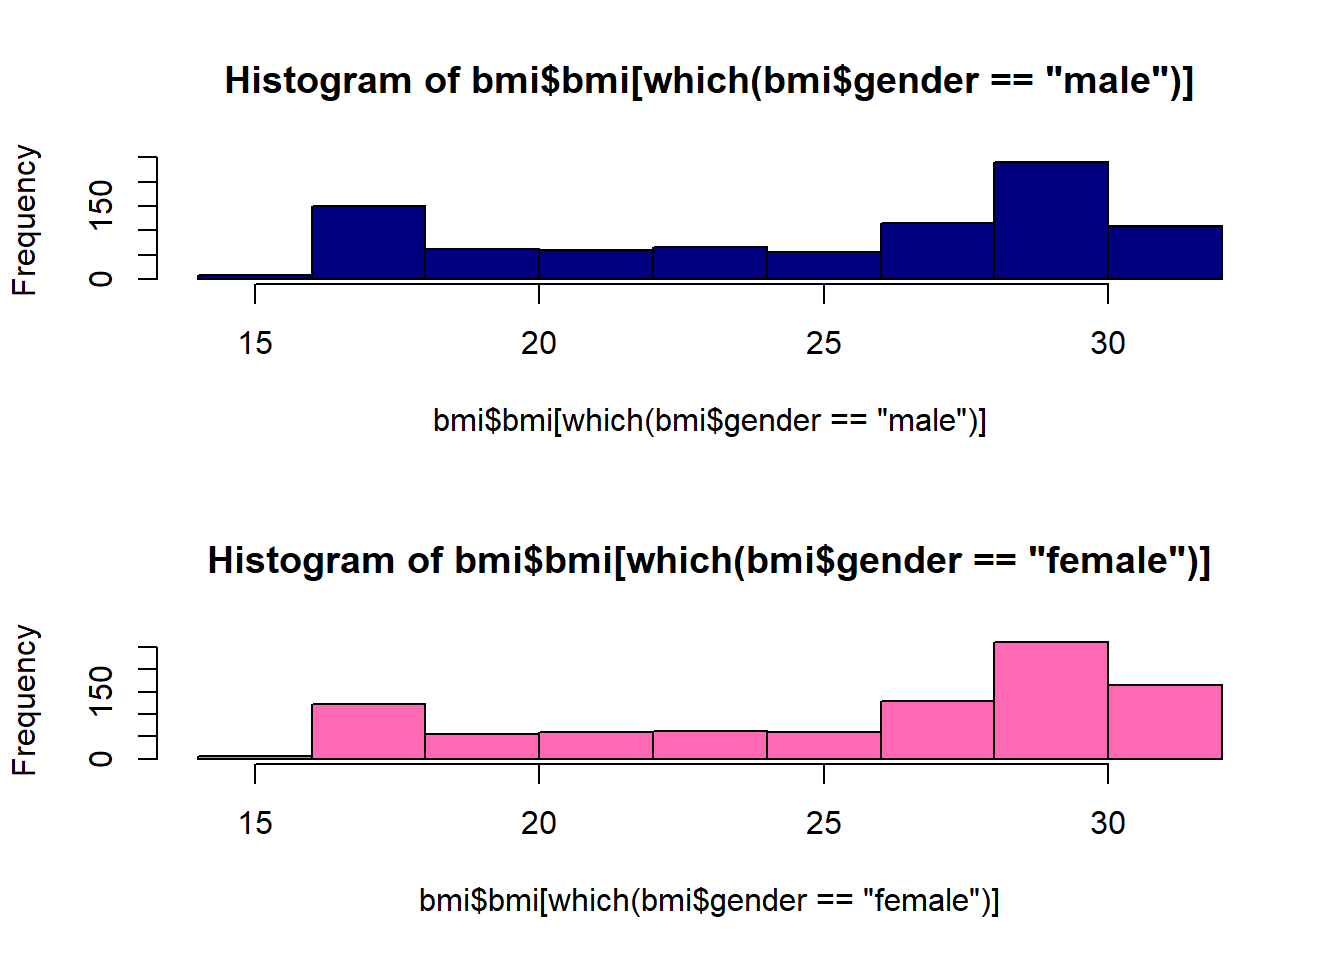
This is my BMI data
Plot BMI data
You can also embed plots, for example:
Gorilla plot
plot(bmi ~ steps, data = bmi,
     pch = 16, cex = .7,
     col = c(rep("HotPink", 921),
             rep("navy", 865)))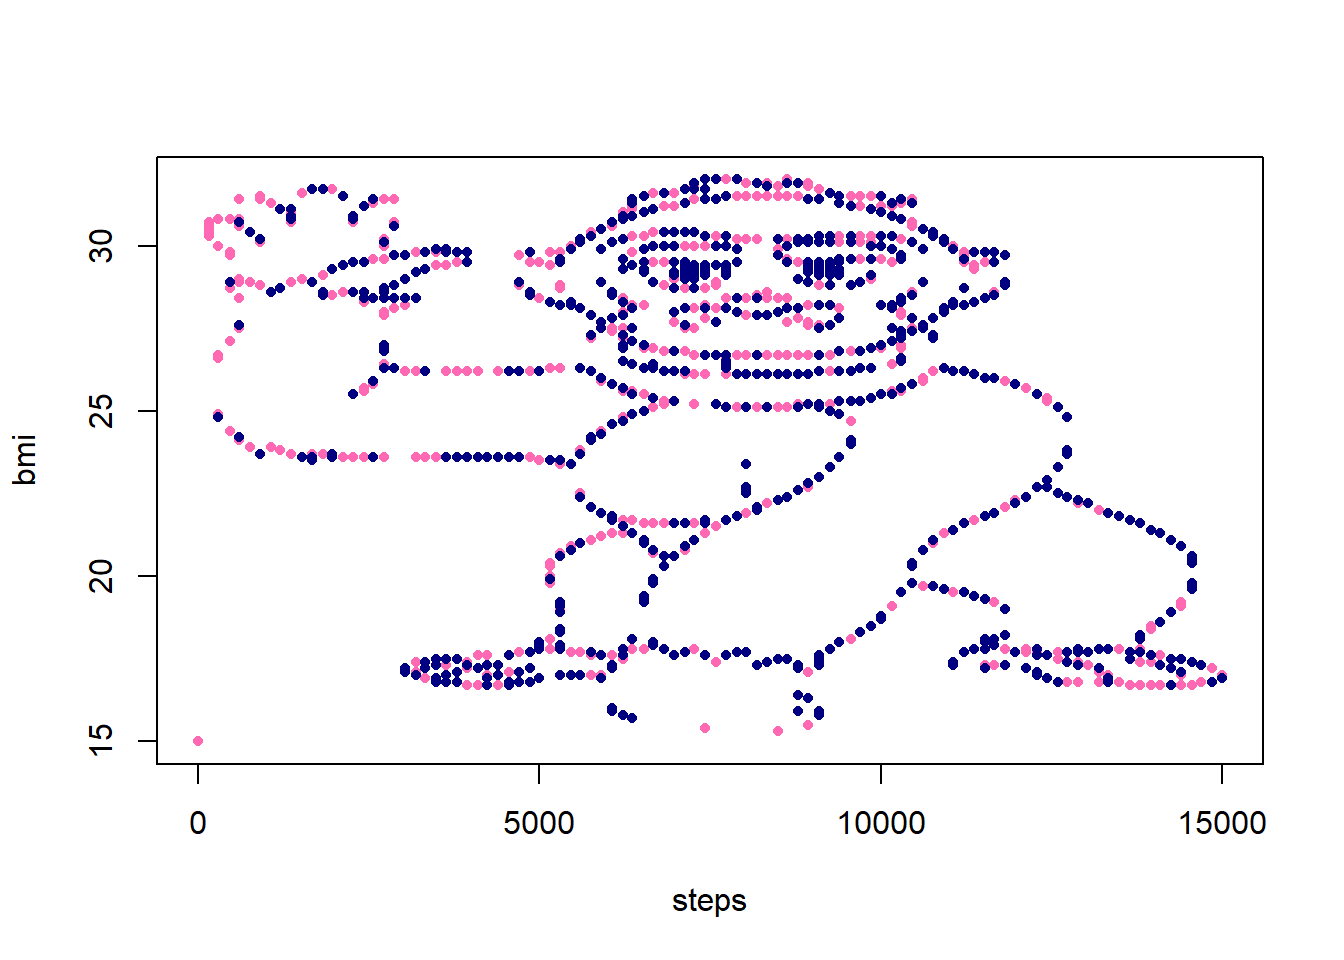
Statistical results
Raw ANOVA table.
Analysis of Variance Table

Response: bmi
            Df Sum Sq Mean Sq F value Pr(>F)
steps        1   3402  3402.2 153.716 <2e-16 ***
gender       1     44    43.9   1.983 0.1592
Residuals 1783  39464    22.1
---
Signif. codes:  0 '***' 0.001 '**' 0.01 '*' 0.05 '.' 0.1 ' ' 1
Matt’s summary
paste('Your R-sqared is: ', round(summary(lm0)$r.squared, 2))[1] "Your R-sqared is: 0.08"